This application is based on the paper by Zhao et al. [1] and was implemented during the course "Visualisierung 2" in the summer semester of 2021 at TU Wien.
The phoenixmap is an abstract 2D visualization which addresses the issue of visualizing multiple spatio-temporal distributions simultaneously. In particular, this approach applies to distributions of objects from multiple different categories or to a single distribution tracked over a certain period of time.
A distribution is described as a set of 2D data points (point cloud) which are dispersed in a certain (geographic) area, for instance in a country or a smaller region such as a natural preserve.
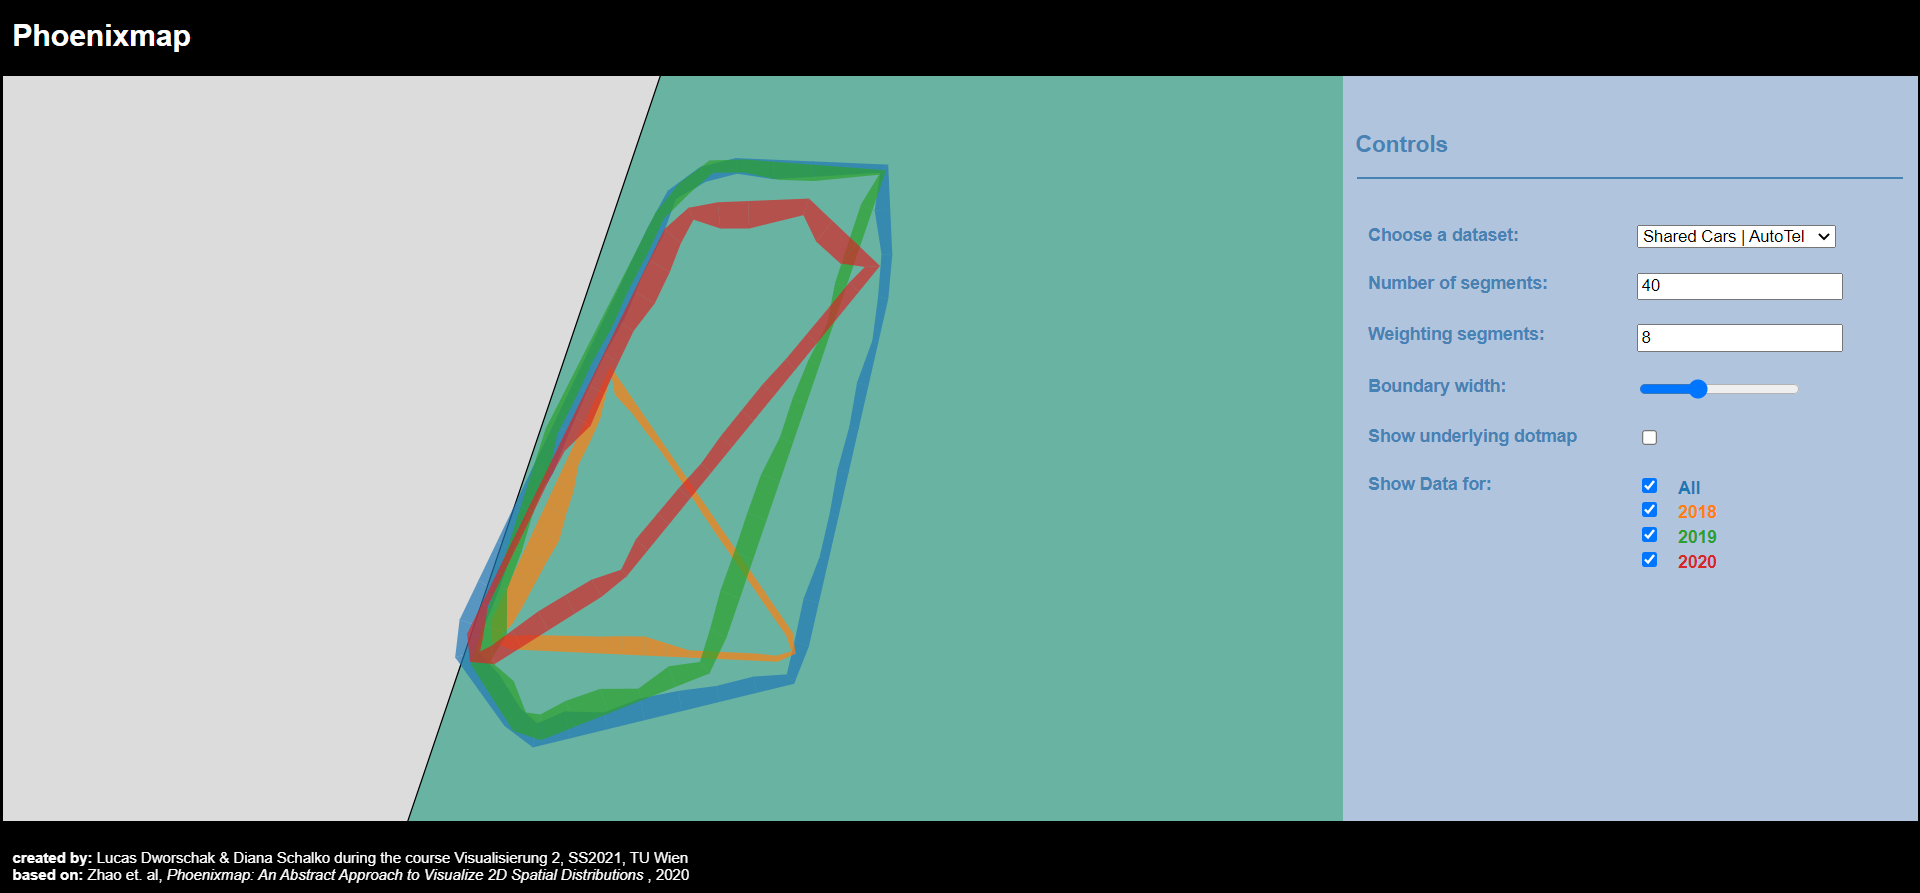
The Phoenixmap represents the distribution as an outline which is divided into segments of varying width. The thickness of a segment amounts to the density of the corresponding region adjacent to the segment.
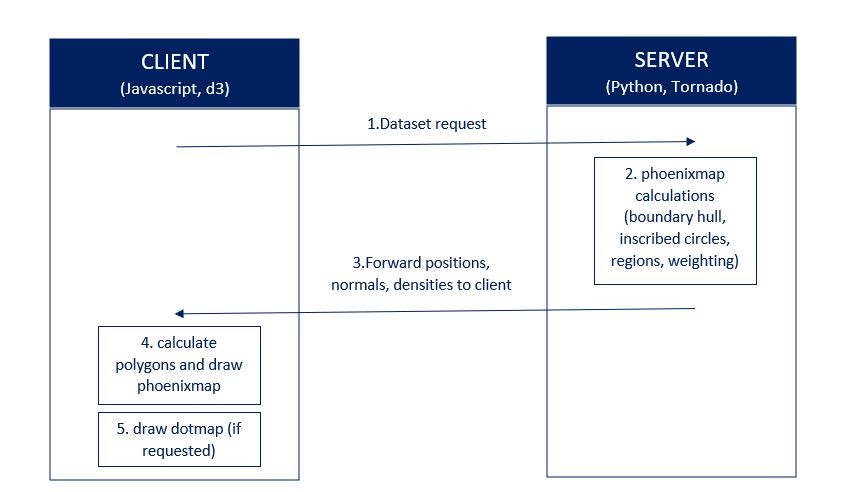
We used a client-server architecture to implement the paper. The client is written in Javascript using the d3 Framework. The server was realized using the Python web framework Tornado.
Firstly, the client sends a request for a dataset to the server. The server is responsible
for all the calculations necessary to create a phoenixmap. After the computations are finished, the server sends its response to the client including
the coordinates of the segment points, the normals of the line segments and the densities.
On the client side we use these values to calculate polygons with varying widths to account for the different densities.
Figure 2 provides an overview.
The calculation of a Phoenixmap was comprised of multiple steps.
Step 1:
Given a set of points from a dataset, we calculated a boundary that would enclose all the data points. To compute the convex hull around
the data points, we implemented the Graham Scan algorithm [2].
The computed boundary was then offset by a constant amount.
Step 2:
We divided the hull into n segments of equal length (by default n equals to 40). Each of these segments corresponds to a line segment
and has a starting point vi and an end point vi+1.
Step 3:
Next we calculated inscribed circles for each of the line segments. The center points of the inscribed circles together with the segment points were used to create regions.
Step 4:
For each of these regions we did the following: Count how many data points lie within the segment (num) and calculate the area A of the segment. The density
corresponding to the region equals to num/A.
Step 5:
Finally, a weighted arithmetic mean was applied to the densities. We took the density and area values of x neighboring segments and firstly, summed up density*area across all corresponding segments
and secondly, divided the result by the total area of the segments involved. At this stage, we calculated all necessary information to visualize the phoenixmap.
A more in depth explanation of how we tackled the different steps can be found in our code documentation.
As can be seen in the Controls section of figure 1, the user has multiple options to alter the visualization.
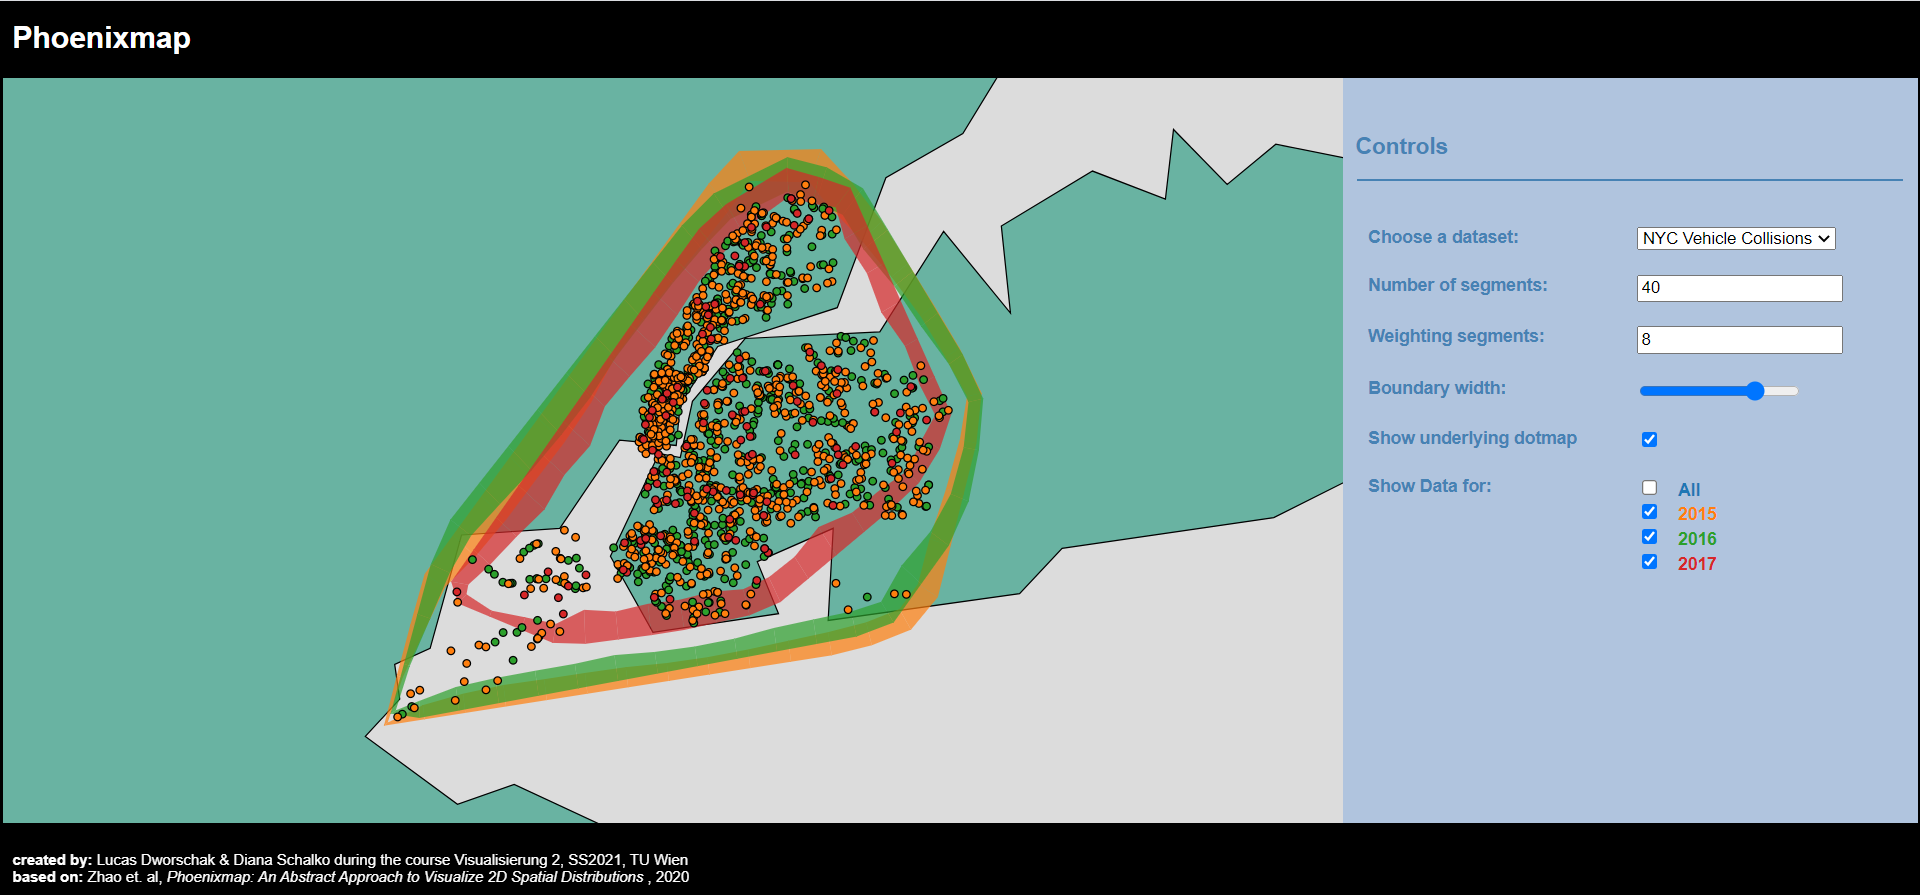
In order to create a phoenixmap a dataset has to include longitude and latitude information. All of the three datasets provided this information and were well organized.
Furthermore, we chose these datasets to highlight the flexibility of the phoenixmap and its ability to create meaningful visualizations for a variety of data sets.
We used these datasets for our application:
[1] Zhao et. al, Phoenixmap: An Abstract Approach to Visualize 2D Spatial Distributions , 2020
[2] https://brilliant.org/wiki/convex-hull/, last visited: 03.06.2021 20:17
[3] https://www.kaggle.com/gidutz/autotel-shared-car-locations, last visited: 04.06.2021 16:20
[4] https://www.kaggle.com/ankkur13/boston-crime-data, last visited: 04.06.2021 16:20
[5] https://www.kaggle.com/nypd/vehicle-collisions, last visited: 04.06.2021 16:20